SQL Server Reporting Services (SSRS)
(Introduction) |
OverviewSQL Server Reporting Services 2008 (SSRS) is a feature included in the SQL Server 2008 product. We use SSRS to design, develop, test, and deploy reports. SSRS was originally slated to be released with SQL Server 2005 but it wound up being released a little bit ahead of SQL Server 2005. SSRS leverages the Business Intelligence Development Studio (BIDS) developer tool for all aspects of authoring and deploying reports. BIDS is included with SQL Server 2008.
In this tutorial we will step through a number of topics that you need to understand to successfully build a report. Our high level outline is as follows:- Reporting Services Components
- Install Reporting Services
- Business Intelligence Development Studio (BIDS)
- Install Sample Database
- Create a Simple Report with the Wizard
- Create a Simple Report with the Report Designer
- Deploy Reports
- Configure Report Manager Security
Reporting Services Components
(Introduction) |
OverviewSQL Server Reporting Services 2008 (SSRS) is a full-featured application that provides report design, development, testing, and deployment. In this section we will introduce the main components of the product:
- Databases
- Windows Service
- Report Designer
· Reporting Services Components - Databases
|
OverviewReporting Services creates and uses two SQL Server 2008 databases named ReportServer and ReportServerTempDB by default. The ReportServer database has tables to store reports, data sources, snapshots, subscriptions, etc. It is the repository for the reporting application data. The ReportServerTempDB database is used for temporary storage needs, as the default name suggests. When you allow the SQL Server 2008 installer to configure Reporting Services, these two databases are created automatically for you. If you want to create them manually, then you need to use the Reporting Services Configuration Manager. In this tutorial we assume that the SQL Server installer is used to configure Reporting Services.
Reporting Services Components - Windows Service
|
OverviewThe core of Reporting Services functionality is implemented as a Windows service. While an in-depth understanding of this implementation is not required to use Reporting Services, it is nonetheless interesting at least in terms of a high-level description.
ExplanationThe Reporting Services Windows service provides the following functionality as shown below in this diagram taken from Books on Line:

The following are the main points about the Windows service:
- The HTTP listener is a new feature; prior versions of Reporting Services required Internet Information Server (IIS). With Reporting Services 2008 IIS is no longer required.
- Report Manager is an ASP.NET application that provides a browser-based interface for managing Reporting Services. We will cover the Report Manager in a later section.
- The Web Service is also implemented as an ASP.NET application; it provides a programmatic interface to Reporting Services. The Report Manager uses the web service. You can use the web service to create your own custom implementation of any feature provided by the Report Manager.
- Background Processing provides the core services for Reporting Services.
- The Report Manager, Web Service, and Background Processing are each implemented as separate application domains.
· Reporting Services Components - Report Designer
|
OverviewThe Report Designer provides the capability to design, develop, test and deploy reports. Report Designer is a developer-centric tool called Business Intelligence Development Studio (BIDS) that comes with SQL Server 2008. The 2008 version of BIDS has an updated and more intuitive user interface and many new charts and graphs for enhanced visualizations. We will cover BIDS in later sections of the tutorial.
For non-developers SQL Server 2008 has a new and enhanced version of Report Builder, which was first released with SQL Server 2005. We will not be covering Report Builder in this tutorial. You can get an introduction to the tool by reading one of our tips noted below.
Install Reporting Services
|
OverviewSQL Server Reporting Services 2008 (SSRS) is a feature included in the SQL Server 2008 product. To install SSRS you run the SQL Server 2008 SETUP.EXE program which guides you through the various installation and configuration options for the product. In this section we will discuss the installation and configuration options that pertain to installing SSRS.
ExplanationAs you proceed through the SQL Server 2008 installation process, you will reach the Feature Selection dialog. Click the checkbox for Reporting Services to perform the installation of SSRS as shown below under Instance Features:

Note that you should also probably check everything under Shared Features, especially Business Intelligence Development Studio as we use this tool to design, develop, test, and deploy reports.
Later in the SQL Server 2008 installation process you will reach the Reporting Services Configuration dialog as shown below:

Select the first option - Install the native mode default configuration. This will install SSRS and configure it for you automatically. SharePoint integrated mode disables the Report Manager and allows you to store reports in SharePoint document libraries; to run a report you simply click on it. The last option is useful where you want to configure the report server manually using the Reporting Services Configuration Manager.
You can begin using SSRS as soon as the SQL Server 2008 installation is complete, assuming you chose Install the native mode default configuration.
Business Intelligence Development Studio (BIDS)
(Introduction) |
OverviewBIDS is the tool that we use to develop reports. It provides an intuitive interface based on Microsoft's Visual Studio product which has been used by developers for many years. The SQL Server 2008 version of BIDS has some nice enhancements to the user interface for designing, developing and testing reports. You will see these enhancements as we go through this tutorial.
BIDS is included with SQL Server. When you are running the SQL Server installer, you need to click the Business Intelligence Development Studio checkbox in the Shared Features section in order to install BIDS. You probably want to select all of the items in the Shared Features section. After completing the installation, you can launch BIDS from the Microsoft SQL Server 2008 program group.
Business Intelligence Development Studio (BIDS)
(Projects and Solutions) |
OverviewThe BIDS paradigm for developing reports is based on the concept of projects and solutions. A project is a container for one type of object such as SSRS reports, web pages, SQL Server Integration Services packages, etc. Projects can be used to organize things in a meaningful way. For instance I could have a project for all reports used by the Accounting department, another project for Human Resource department reports, and another project for the Finance department reports.
A solution is a container for one or more projects. Think of a solution as the complete application that can be made up of a number of different types of projects such as a report project, SQL Server Integration Services project, a web project, etc.
In this section we will walk through creating an empty solution and adding a report project to that solution. In the sections that follow we will add reports to our report project.
ExplanationTo begin launch BIDS by selecting SQL Server Business Intelligence Development Studio from the Microsoft SQL Server 2008 program group. Click File, New Project on the top-level menu to display the New Project dialog. Click Visual Studio Solutions under Project Types, Blank Solution under Visual Studio installed templates, and enter the Name and Location as shown below:

Click OK to create a blank solution. Now we want to add a project to our solution. Remember a solution is just a container for one or more projects. By creating a blank solution, we can add multiple projects that make up the complete solution that we are building.
Click File, Add, New Project from the top-level menu to add a Report Server project to the solution. Fill in the Add New Project dialog as shown below:

We are now ready to move on to our next section where we will install the sample database that we will use to build our reports.
Install Sample Database
|
OverviewWe will use the AdventureWorksLT sample database as the data source for the reports we build in this tutorial. The AdventureWorksLT database was chosen because it is small and the current SQL Server 2008 sample database requires that Full-Text Search be installed, the SQL Full-Text Filter Daemon launcher service is running, and FILESTREAM is enabled. These requirements just add extra work to get us going so we're going to use the slightly older sample database.
ExplanationThe AdventureWorksLT database is available for download from the following link on the Code Plex site: Microsoft SQL Server Product Samples: Database - Release:SQL Server 2005 SP2a. Click on the appropriate AdventureWorksLT link to download the installer program for your SQL Server environment: AdventureWorksLT.msi, AdventureWorksLT_x64.msi, or AdventureWorksLT_IA64.msi.
After downloading the appropriate version of the installer program, run it by double-clicking the .msi file. You will be prompted for the folder location to put the database and log files. For a default installation of SQL Server 2008 the folder to choose is:
C:\Program Files\Microsoft SQL Server\MSSQL10.MSSQLSERVER\MSSQL\DATA
Adjust the folder as necessary if you did not accept the default location during installation of SQL Server 2008.
When the installer program completes, you have to attach the database to your SQL Server database engine. Open SQL Server Management Studio, navigate to the Object Explorer, right click on Databases then select Attach from the menu as shown below:


Click the OK button to attach the database.
Create a Simple Report with the Wizard
|
OverviewIn an earlier section we covered Business Intelligence Development Studio (BIDS), the tool that developers use to create reports. BIDS provides a Report Designer which allows you to define every aspect of your report. In addition BIDS provides a Report Wizard which will guide you through the steps to build a simple report. With the Report Designer you start out with an empty canvas; you define every aspect of the report yourself. When you are getting started with Reporting Services, the Report Wizard should be your first choice. Once you've built a report with the wizard, you can continue customizing it with the Report Designer. When you reach the point where you are comfortable defining every aspect of your reports and you want to build sophisticated reports and dashboards, then you should use the Report Designer.
In this section we will use the Report Wizard to build a simple report. We will walk through the following steps:
- Launch the report wizard
- Create a shared data source
- Design a query
- Select a report type
- Design a table
- Choose the table layout
- Complete the wizard
· Launch the Report Wizard
|
OverviewThe Report Wizard guides you through the steps to build a simple report. In this section we will launch the report wizard and get going with creating our first report.
ExplanationIn the earlier section on Projects and Solutions, we created a blank solution and added a Report Server project to the solution. If necessary open the solution by clicking File, Open, Project/Solution from the top-level menu and navigating to the solution file; e.g. MSSQLTips_SSRS_2008_Tutorial.sln. The BIDS Solution Explorer shows our Report Server project along with Shared Data Sources and Reports nodes as shown below:

Right click on the Reports node and select Add New Report to launch the Report Wizard as shown below:

Note the checkbox "Don't show this page again". You way want to click it as there isn't much need to see this dialog every time you want to design a new report using the wizard. Click the Next button to create a data source for your report which we will cover in the next section.
Create a Shared Data Source
|
Overview
The Data Source contains the information necessary to retrieve the data we want to render on our report. Reporting Services can access data in relational databases, OLAP databases, and just about other any data source for which you have an ODBC or OLE DB driver.
The Data Source contains the information necessary to retrieve the data we want to render on our report. Reporting Services can access data in relational databases, OLAP databases, and just about other any data source for which you have an ODBC or OLE DB driver.
When we create a Data Source we can specify it as shared which means it can be used by any report in the same project. As a general rule you probably want to create Shared Data Sources. If a Data Source isn't shared it just means that its definition is stored inside the report and it cannot be shared with another report.
In this section we will walk through the details of creating a Shared Data Source.
ExplanationAfter launching the Report Wizard you will be presented with the Select the Data Source dialog as shown below:

Our project does not have any Shared Data Sources yet so we do not have the option of selecting an existing Shared Data Source for our new report. Instead we will have to define a Data Source. We will have to supply the following:
- Name - choose a descriptive name for this Data Source; we'll use AdventureWorksLT. Do not put any spaces in the name; if you do you will get an error message when you complete the wizard and your Data Source will not be created
- Type - select from the available options in the dropdown list; the default value of Microsoft SQL Server is the correct one for the AdventureWorksLT database that we are using
- Connection String - enter the connection string for your Data Source; usually you will want to click the Edit button to enter the details and have the connection string created for you
- Edit button - rather than entering the connection string, click this button to display the Connection Properties dialog where you can enter some information and have the connection string created for you
- Credentials button - click this button to display the specify Data Source Credentials dialog where you can specify the credentials to use when connecting to your Data Source
- Make this a shared data source checkbox - click this checkbox to create a Shared Data Source; any report in the same project can the use this Data Source
Click the Edit button to display the Connection Properties dialog; fill in your Server name and select the AdventureWorksLT database as shown below:

The Server name is the one where your SQL Server database is deployed. If you are running a named instance of SQL Server, you will need to specify the Server name as SERVERNAME\INSTANCENAME. If you are running SQL Server locally you can specify localhost in place of SERVERNAME. You should click the Test Connection button to verify that you are able to connect to the database then click OK to close the dialog.
Click the Credentials button to display the Data Source Credentials dialog as shown below:

The default selection Use Windows Authentication (Integrated Security) is okay for our purposes. This means that Reporting Services will connect to the Data Source using the Windows credentials of the person running the report. Note that when your report is complete and you deploy the report and Data Source for others to use, you can select a different option if necessary. For now we'll stick with the default.
After completing the above steps, the Select the Data Source dialog will look as shown below:

Click Next to move on to the Design the Query dialog which we will discuss in the next section
Design the Query
|
Overview
The Design Query step of the Report Wizard allows us to specify what data we want to retrieve from our Data Source and render in our report. In this section we will walk through the details of defining a query to retrieve the data to render on our report.
The Design Query step of the Report Wizard allows us to specify what data we want to retrieve from our Data Source and render in our report. In this section we will walk through the details of defining a query to retrieve the data to render on our report.
ExplanationThe Design the Query step in the Report Wizard will display the dialog as shown below:

You can click the Query Builder button to graphically build your query or you can type your query directly into the Query string textbox. The following is an example of a query that you could type in:
SELECT
c.ParentProductCategoryName
, c.ProductCategoryName
, SUM(d.LineTotal) Sales
FROM SalesLT.Product p
JOIN SalesLT.vGetAllCategories c
ON c.ProductCategoryID = p.ProductCategoryID
JOIN SalesLT.SalesOrderDetail d
ON d.ProductID = p.ProductID
GROUP BY
c.ParentProductCategoryName
, c.ProductCategoryName
ORDER BY
c.ParentProductCategoryName
, c.ProductCategoryName
|
The above query will provide us with a sales summary broken down by product category. Copy and paste the query into the Query string textbox in the Design the Query dialog. Alternatively you could click the Query Builder button and graphically design the same or a similar query. The Query Builder dialog displays the Query designer that you are accustomed to seeing in products like Microsoft Access.
Click Next to move on to the Select the Report Type dialog which we will discuss in the next section.
Select the Report Type
|
Overview
The Select Report Type step of the Report Wizard allows us to choose from a Tabular or Matrix type of report. In this section we will discuss the details of these available report types.
The Select Report Type step of the Report Wizard allows us to choose from a Tabular or Matrix type of report. In this section we will discuss the details of these available report types.
ExplanationThe Select Report Type step in the Report Wizard will display the dialog as shown below:

The tabular report type is the traditional report with page headings, column headings, subtotals and totals running down the page. The matrix report type is one where we define the fields that go on the columns and rows. In addition the matrix report type provides interactive drilldown capabilities. We'll create a tabular report as this will provide a simple and familiar example.
Click Next to move on to the Design the Table dialog which we will discuss in the next section.
Design the Table
|
Overview
The Design Table step of the Report Wizard allows us to layout the available fields on our report choosing between Page, Group, and Details.
The Design Table step of the Report Wizard allows us to layout the available fields on our report choosing between Page, Group, and Details.
ExplanationThe Design Table step in the Report Wizard will display the dialog as shown below:

The Available fields list is populated based on the query that you defined in the previous step in the Report Wizard. Click on a field then click on the appropriate button where you want to put that field. Fill in the dialog as shown below:

The following is a description of the buttons in the above dialog:
- Page - put a field in this list when you want to begin a new page when the value of the field changes; e.g. to start each ParentProductCategory on a different page
- Group - group by the fields in this list
- Details - the fields in this list appear in each row of the report
Click the Next button to move on to the Choose the Table Layout dialog which we will discuss in the next section.
Choose the Table Layout
|
Overview
The Choose Table Layout step of the Report Wizard allows us to choose a stepped or blocked layout and whether to include subtotals and enable drilldown.
The Choose Table Layout step of the Report Wizard allows us to choose a stepped or blocked layout and whether to include subtotals and enable drilldown.
ExplanationThe Choose Table Layout step in the Report Wizard will display the dialog as shown below:

The default of Stepped displays the groupings as shown above. Block moves things in a little closer which saves space, but it disables drilldown. Include Subtotals will provide intermediate totals based on groupings. Enable drilldown will initially hide details and allow expanding with a click on the plus icon.
Fill in the dialog as shown below:

Click the Next button to move on to the Chose the Table Style dialog which we will discuss in the next section.
Choose the Table Style
|
Overview
The Choose Table Style step of the Report Wizard allows us to choose from a number of different styles. This is a purely cosmetic choice; each selection provides a different color scheme.
The Choose Table Style step of the Report Wizard allows us to choose from a number of different styles. This is a purely cosmetic choice; each selection provides a different color scheme.
ExplanationThe Choose Table Style step in the Report Wizard will display the dialog as shown below:

Choose a style from the list of available options the click the Next button to move on to the Completing the Wizard dialog which we will discuss in the next section.
Complete the Wizard
|
Overview
The Completing the Wizard step of the Report Wizard displays a summary of our choices from the previous dialogs.
The Completing the Wizard step of the Report Wizard displays a summary of our choices from the previous dialogs.
ExplanationThe Completing the Wizard step in the Report Wizard will display the dialog as shown below:

You should provide a descriptive name for your report in the Report Name textbox; e.g. ReportWizardExample. You can click the Preview report check box if you would like to see what your report will look like. Scroll through the Report summary to review your choices. If there is something you want to change, click the Back button to revisit the completed dialogs.
Click the Finish button to have the wizard generate your report. You will now see your report in the Solution Explorer as shown below:

The report will also be displayed in the Report Designer. Click on the Preview tab to render your report. A portion of the report is shown below:
We're going to make a couple of changes to the report. Click on the Design tab; you will see the following:

We're going to put spaces between the words in the heading, make the columns a little wider, and change the format of the sales numbers. Here are the steps:
- Click in the report heading between the t and W; add a space; do the same for d and E
- Click in the ParentProductCategory cell, an Excel-like grid will appear, click between the cells at the top of the grid and drag to widen them; you will see the cursor change to <--> when you hover between the cells
- Click inside the [Sum(Sales)] column, locate Format in the Properties window and type C0; this will format the cell as currency with no decimals. If you don't see the Properties window, click the top-level View menu then select Properties Window of click F4. Repeat for the [Sales] column.
After making these changes the report design should look like this:

Click on the Preview tab to display the report:

You can click on the + icon to the left of the Parent Product Category Names to drilldown to Product Category Name details as shown below:

This completes our tutorial section on the Report Wizard.
Create a Report using the Report Designer
|
OverviewIn the prior section we created a report using the Report Wizard in Business Intelligence Development Studio (BIDS). In this section we will create a report from scratch using the Report Designer in BIDS. With the Report Designer you start out with an empty canvas; you define every aspect of the report yourself. The Report Designer allows you to create sophisticated reports and dashboards.
In this section we will complete the following steps in the Report Designer to build a simple report:
- Add a new report to our project
- Create a shared data source
- Create a Dataset
- Configure a Table
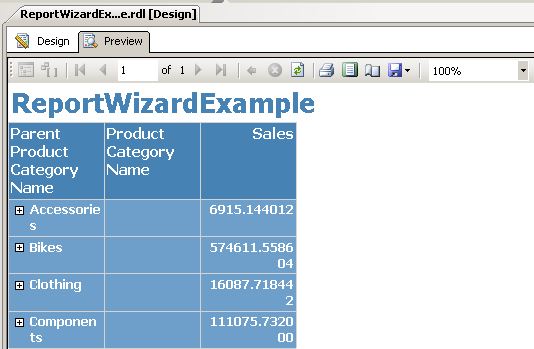
The following screen shot shows the report that we will build as rendered in the Report Manager:

The above report is based on the same query that we used in the earlier Report Wizard section. The plus sign icon to the left of the value in the Parent Product Category column allows us to drilldown to the Product Category details.
Now let's continue on to the next section and begin to create our report.
Create Report
|
OverviewThe first step in creating a report is to add a new report to our project.
ExplanationIn the earlier section on Projects and Solutions, we created a blank solution and added a Report Server project to the solution. In the previous section we added a new report by stepping through the Report Wizard. The BIDS Solution Explorer shows our Reports project along with the Shared Data Source and ReportWizardExample that we created in the previous section:

Right click on the Reports node then select Add, New Item which will display the Add New Item - Reports dialog; fill in the dialog as shown below:

Click the Add button to add a new report to your project. Your new report will be displayed in the Report Designer. Let's spend a minute to review the Report Designer before we continue with our task of creating a new report from scratch.
There are three parts of the Report Designer which you will be using:
- Design Surface - palette where you layout your report
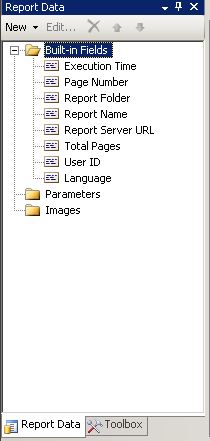
- Report Data - allows you to define Data Sources, Datasets, Parameters and Images; allows you to access a group of built-in fields like Report Name, Page Number, etc. You will drag and drop items from this area onto the design surface.
- Toolbox - contains the Report Items that you drag and drop onto the design surface; e.g. Table, Matrix, Rectangle, List, etc.
Whenever you add a report to your project or open a report the design surface will be displayed. After adding a report you will see the following blank design surface:

You can display the Report Data and Toolbox areas by selecting them from the top-level View menu if they aren't shown. The Report Data and Toolbox are used a lot so I like to position them to the left of the designer. The Report Data area is shown below:
Create a Shared Data Source
|
OverviewWe discussed the Shared Data Source in the earlier section on using the Report Wizard to create a new report. The Data Source contains the information that Reporting Services needs to retrieve the data that we want to render on our report. A Shared Data Source is one that can be used by any report in the same project. In this section we will create a Shared Data Source.
ExplanationTo create a Shared Data Source click on the New button in the Report Data area then select Data Source from the menu as shown below:

The Data Source Properties dialog will be displayed as shown below:

The first thing to do is to provide a name; enter AdventureWorksLT in the Name textbox. Since we already defined a Shared Data Source in the earlier section on using the Report Wizard to create a new report, click the Use shared data source reference radio button and select AdventureWorksLT from the dropdown list. The Data Source Properties dialog is shown below:

At this point we are done. If you need to create a new Shared Data Source, you would click the New button and complete the Shared Data Source Properties dialog. This is essentially the same thing we did back in the Report Wizard section of the tutorial.
We can now see our Shared Data Source in the Report Data area as shown below:

We are now ready to continue on to the next section and create a Data Set.
In the screen shot above Report Data and the Toolbox share the same area of the screen; click on the tab at the bottom to switch between them. The Toolbox contains the following elements that you will drag and drop onto the design surface:

Note in the heading of Report Data and the Toolbox there is a push pin icon. Clicking this toggles between showing the tab and hiding it by putting a button that you can hover over to display the tab.
You can customize what you see in the report designer as well as position it however you like. Click on the Report Data or Toolbox heading and you can drag it around and position it.
At this point let's continue on to the next section and create a Shared Data Source.
Create a Data Set
|
OverviewA Data Set contains a query that Reporting Services uses to retrieve the data for our report. This query could be a SQL statement like we used in the Design the Query step of the Report Wizard section; it could also be a stored procedure that we execute. In this section we will define a new Dataset by using the same query that we used earlier in the Report Wizard section.
ExplanationTo create a Dataset right click on the AdventureWorksLT Shared Data Source that we created in the previous section and select Add Dataset from the menu as shown below:

The Dataset Properties dialog will be displayed as shown below:

The first thing to do is to provide a name; enter Main in the Name textbox. Since we only have one Shared Data Source in our project, it will be selected automatically in the Data source dropdown. To define our query we could click the Query Designer button and do it graphically or we could type in the query as we did in the Report Wizard section. Instead click the Import button which will initially display the familiar Open File dialog; navigate to the report that we created earlier in the Report Wizard section of the tutorial as shown below:

Click OK to display the Import Query dialog as shown below:

The above dialog displays the Datasets and their queries from the report. Our earlier report has only one Dataset so just click the Import button. If the report had multiple Datasets, you could choose the Dataset from the list on the left.
The Report Data area now shows our new Dataset and the list of available fields as shown below:

We are now ready to continue on to the next section to configure a Table for our report layout.
Design Report Layout
|
OverviewThe Toolbox contains a number of Report Items that you drag and drop onto the design surface when creating a report. The Table provides the traditional report layout where you render data in a fixed number of columns and a variable number of rows. In this section we will use the Table to define the same report layout that we used earlier in the Report Wizard section.
ExplanationTo add a Table to the design surface, simply click Table in the Toolbox then drag and drop it onto the design surface. The design surface should look like this:

Recall from our previous step where we created a Dataset; the Report Data is shown below:

Drag and drop the ProductCategoryName and Sales fields (one at a time) onto a column of the Data row of our Table as shown below:

Click the Preview tab to render the report; a portion of the rendered report is shown below:

Click on the Design tab and focus on the Row Groups at the bottom as shown below:
We want our report to show the ParentProductCategory broken down by the ProductCategory. Click the arrow on the (Details) line shown above then click Add Group, Parent Group; fill in the Tablix group dialog as shown below:

The Table now looks like this:

Right click on the gray border above the empty column and select Delete Columns from the menu. Click on the Group1 cell and change the text to Parent Product Category. Click and drag the gray border above the column headings to make them a little wider. Click the Preview tab to render the report:

At this point we are almost done; we need to add Parent Product Category totals, drilldown capability to show/hide the Product Category details, a grand total, and some general cosmetic cleanup. Click on the Designer tab to continue.
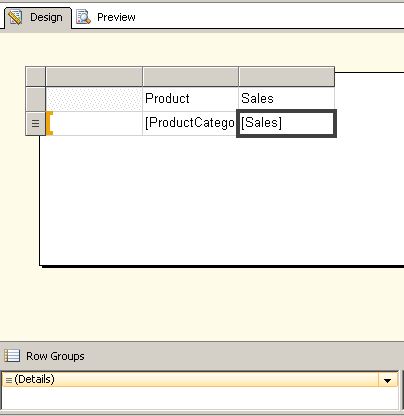
To add the Parent Product Category totals, hover the mouse over the empty cell in the Sales column on the ParentProductCategoryName row; a little icon will appear; click the icon and select Sales from the popup menu. You will see the expression [Sum(Sales)] as shown below:

To add the drilldown capability, right click on the gray border on the bottom row in the designer and select Row Visibility from the popup menu. Fill in the Row Visibility dialog as shown below:
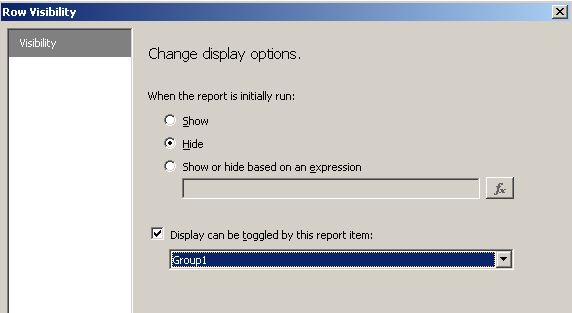
The above settings will initially hide the Product Category details and add the plus sign icon next to the Parent Product Category to toggle the drilldown. The name Group1 was assigned when we added the Parent Product category group. Click the Preview tab to render the report:

Click the Design tab then click the arrow on the Details line inside the Row Groups area; select Add Total, After from the popup menu. You will now see a row after the detail row; edit the blank cells on the total lines to specify a description as shown below:

Finally for the cosmetic changes, drag and drop a text box above the table and provide a heading for the report. Click in the Sales cells and specify C0 (i.e. Currency with no decimals) as the Format property in the Properties window (click View the Properties on the top-level menu if you don't see the Properties window). Click Preview to see the completed report:

This completes the section on creating a report from scratch. We are now ready to continue on to the next section to discuss the options for deploying reports.
No comments:
Post a Comment